BIRT, which stands for Business Intelligence and Reporting Tool, is a technology platform that is being widely adopted for open source reporting in present times. It is an Eclipse-based open-source reporting tool that provides powerful features such as design layout, data access and scripting.
Open source BIRT consists of two main components:
- BIRT Report Designer
- BIRT Runtime (BIRT Report Engine)
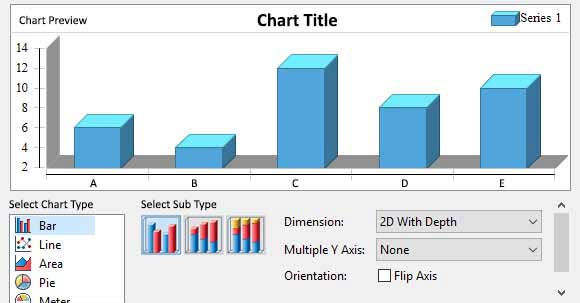
Another exciting feature of BIRT is its charting engine that helps add customized charts, an important way to display data in business intelligence.
Catch a glimpse of the high level BIRT architecture below:
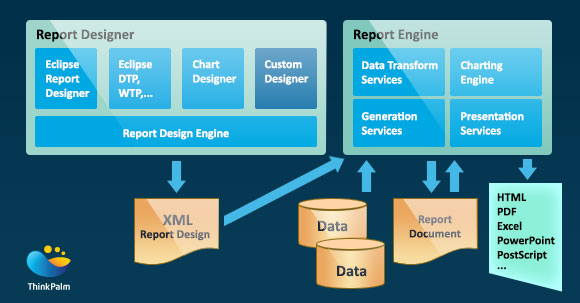
To generate a report, this tool requires a report design file (.rptdesign), which is an XML file that contains the complete information on the report’s look and feel, data sources to be contacted, SQL queries to be run and more.
ThinkPalm has embarked on this trending reporting technology by successfully implementing it in one of our flagship projects on school management. We were able to successfully represent a plethora of student information in processed, visually appealing report cards for the end users.
Overview of BIRT workflow in our project:
- In order to generate the design for report, data was provided from sources such as database, xml, etc.
- JDBC Data Source was used to fetch data from database. MySQL connector was imperative to establish connection.
- After the connection was established, a dataset was created to fetch the data using the SQL queries. If the report design is more complex, then multiple data sources and datasets can be created and combined to form a single report.
- The acquired dataset was used to display data in tables, grids and charts.
- The BIRT supports rhino Javascript to process dataset such as calculating sum, percentage and many more Javascript functions. The percentage, grade and bar spacing for charts were calculated using Javascript for displaying the report card of a particular student.
- The report design (.rptdesign) file is then deployed on the web application server and the web application was viewed through BIRT runtime.
The Eclipse BIRT reporting tool helped to meet a practical business need of our project. It allows users to create and deploy graphically rich, parameter driven reports.
BIRT Report Engine
Since BIRT is an eclipse based reporting tool and its output is a .rptdesign file, it must be run through the BIRT engine to view this file as an HTML file. This can be done in two ways, one is through the BIRT viewer engine and the other is through BIRT runtime engine.
BIRT Viewer Engine generates the report comparatively easily with minimal coding and prints the report in multiple formats such as PDF, JPG, EXCEL, CSV, etc. But, the interface provided is static and may not merge seamlessly with the web applications interface. On the other hand, BIRT Runtime Engine requires a lot more programming for setting up and print functionality (apart from PDF and HTML), but this can be integrated much faster and perfectly as a part of the web application, replicating the complete look and feel of the application.
Haven’t embarked on BIRT yet? Make sure you give this next-generation business intelligence reporting tool a try!
 Tessy John
September 13, 2017
Tessy John
September 13, 2017